More and more consumer digital cameras are now including a histogram display either during the Record mode or in the Playback mode. This tutorial explains just what the histogram is and how you can use it to ensure a correctly exposed picture.
What The Histogram Is
The histogram is simply a graph that allows you to judge the brightness of an image. You can think of the area under the graph as comprising all the pixels in your captured digital image. The left side of the histogram depicts how many "dark" pixels you have captured; the right side, how many "bright" pixels you have captured.
Let's look at the histograms of three pictures I took to illustrate how to read and use a histogram:
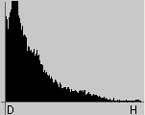
The left histogram indicates you have most of your pixels toward the dark. The pixels also touch the left edge, indicating underexposure. If Goldilocks had stumbled onto this histogram while taking a picture, you can hear her saying something to the effect: "This picture is too dark."
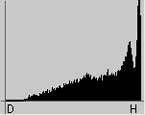
The right histogram indicates you have most of your pixels toward the highlight. The pixels also touch the right edge, indicating overexposure. Looking at this histogram, Goldilocks would wail something to the effect: "This picture is too bright."
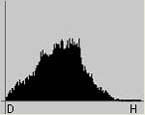
The middle histogram depicts a correctly exposed picture with the pixels mostly in the middle, i.e. neither too dark nor too bright. (Goldilocks: "This picture is just right.") Notice a few pixels touch the dark edge, so we should also expect a few very dark spots in the picture.
Perhaps the best way to understand the histogram is to look at the sample shots that go with the above three histograms.
No comments:
Post a Comment